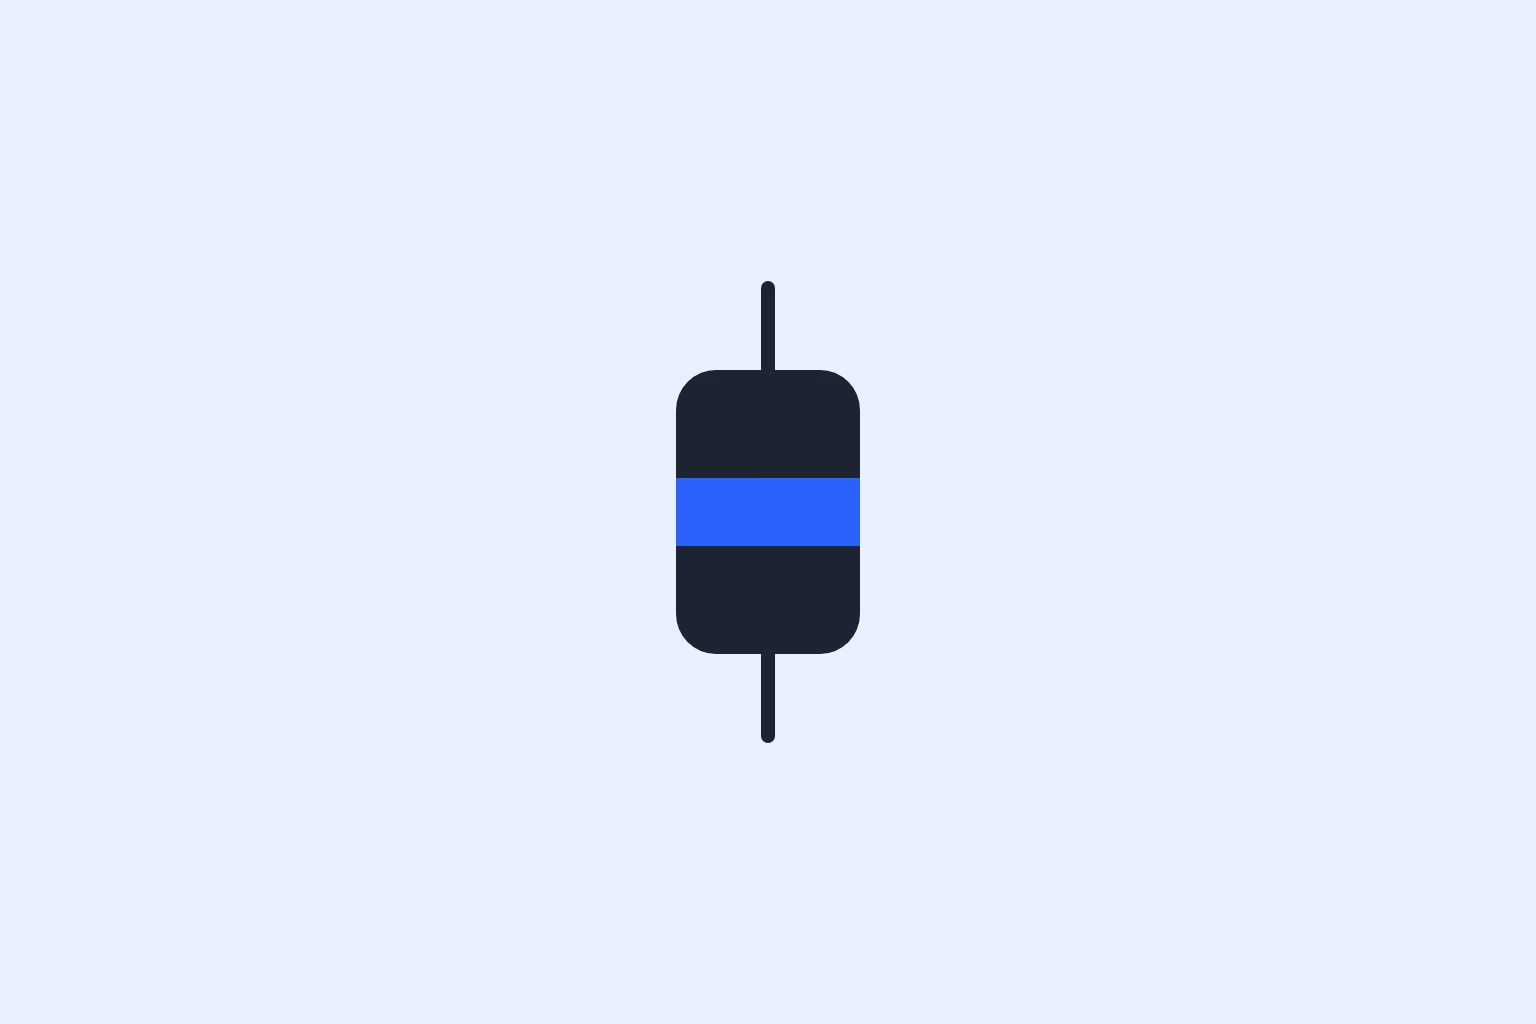
Here is one bar. Binance USDⓈ-M perpetual, BTCUSDT, the minute beginning 13:46:00 UTC. It came off the klines endpoint as a bare array of twelve values, and it is the single most common unit of input in retail-and-adjacent quant research. Almost every strategy we generate touches something shaped like this.
So let's take it apart, index by index, and see how much of it a backtest gets wrong.
| Index | Value | Name |
|---|---|---|
| 0 | 1773495960000 | open time (ms) |
| 1 | "84120.50" | open |
| 2 | "84177.90" | high |
| 3 | "84098.10" | low |
| 4 | "84163.40" | close |
| 5 | "38.417" | base volume (BTC) |
| 6 | 1773496019999 | close time (ms) |
| 7 | "3232108.94" | quote volume (USDT) |
| 8 | 1204 | number of trades |
| 9 | "21.883" | taker buy base volume |
| 10 | "1841203.55" | taker buy quote volume |
| 11 | "0" | ignore |
[0] and [6]: which minute is this, and whose clock says so
Open time 1773495960000, close time 1773496019999. Note the second one: it ends in 19999, one millisecond short of the next bar's open. The window is half-open, and the exchange is telling you so explicitly. Half the data bugs I've chased started with someone treating both endpoints as inclusive and double-counting a trade at the boundary, or aligning a resample so that each 5-minute bar borrowed a millisecond from its neighbour.
The timestamps are exchange matching-engine time. Not your clock, not your vendor's ingestion clock, and not the same clock the funding snapshot uses. When you join a kline series against a funding-rate series or an open-interest series pulled from a different endpoint, you're joining across sources that agree to within roughly a second, most of the time. For a 1-minute strategy that's a 1.7% timing error on every joined row. For anything sub-minute it's fatal.
And this bar is stamped at its open. The information in it is not knowable until 13:46:59.999. Every indexing convention question — do I shift by one, do I use bar-close or bar-open timestamps as my event time — is really the same lookahead question in a costume.
[1] "84120.50": the open you can't trade
The open is the price of the first trade that printed inside the window. It's a completed transaction between two other people. By the time the bar exists as a row in your dataframe, that price is sixty seconds old.
The previous bar closed at 84109.80, so there's $10.70 of price movement sitting in the gap between two adjacent 1-minute bars. That's 1.3 basis points, invisible on a chart, and roughly a quarter of the taker fee. Fine. But go look at the same series on an alt perp during a US CPI print and those inter-bar gaps run 15 to 40 bps. A backtest that signals on bar close and fills at next-bar open is quietly assuming the gap is zero, and it's zero exactly when it doesn't matter.
[2] and [3]: "84177.90" high, "84098.10" low
These two are where most fill engines go to die, so this section is the long one.
The high and low are extreme prices touched. They carry no size and no duration. From the raw trade tape for this same minute, everything at or below 84100.00 was 0.62 BTC across nine prints inside a 1.4-second window. So a backtest stop at 84100 "fills" — and if your position is 3 BTC, you ate the whole visible book on the way down and the rest of your size got done somewhere in the 84105–84130 walk-back. The bar says the low was 84098.10. The bar does not say that only $52,000 of notional traded there.
The other direction is worse, because it flatters you. Suppose you had a resting limit sell at 84175. The bar's high is 84177.90, so a naive engine fills you at 84175 and books maker rebate rather than taker cost. Whether that fill actually happened depends on queue position at that price level, which the bar cannot know and you probably never recorded. Touched is not filled.
The rule we settled on in our fill engine: a resting limit only fills if the bar trades through the level, not merely to it. Fills at the exact extreme tick require volume-at-price evidence from the trade tape, otherwise they're rejected. It removed about 6% of trades from a typical mean-reversion book and cut one candidate's backtested Sharpe from 1.9 to 1.1. That candidate was never real; the fill rule was just the first thing honest enough to say so.
Related trap: intrabar path. If a bar's range spans both your stop and your take-profit, OHLCV cannot tell you which came first. Every engine has to pick a convention. Ours assumes stop-first, always, which is pessimistic and occasionally wrong and never generates a fake win. If your engine assumes take-profit-first, wide-range bars will manufacture profit out of ambiguity, and wide-range bars are exactly the ones that dominate your PnL distribution.
[4] "84163.40": the least robust number in the bar
The close is the last print in the window. That's it. It might be a 0.002 BTC odd-lot from a bot rounding out a position at 13:46:59.8. This single, structurally arbitrary tick is what most research pipelines use to compute every signal, mark every position, and evaluate every exit.
On BTC perps it barely matters; on a thin altcoin perp at 04:00 UTC it matters enormously, and the difference between two venues' closes for the same minute can exceed your entire per-trade edge. When a strategy's PnL depends on the close specifically, we re-run it marking at the exchange mark price instead, which is index-derived and far harder to poke. If the results diverge, the strategy was trading the artifact.
[5] and [7]: "38.417" and "3232108.94", volume in units of what
Base volume is BTC; quote volume is USDT. Both here, which is a courtesy not all venues extend. The reason to care is aggregation across venues. Coin-margined contracts are quoted in contracts of $100 notional. Some equities feeds report round lots. Prediction market venues report share counts where a share is a dollar-denominated binary claim. Summing "volume" across a mixed universe without normalising to a single notional unit produces a liquidity ranking that's pure nonsense, and it'll be nonsense in a stable-looking way that survives review.
Normalise everything to quote notional at ingest. Store the raw field too, but never let a strategy see it.
[8] 1204: the field that should set your impact model
Trade count divided into base volume gives an average print of 0.032 BTC, about $2,700. If your candidate strategy wants to enter $250,000 at once, it's asking to be roughly 92 times the size of the typical transaction in that minute. That number, not some generic 5-bps slippage constant, is what should drive your square-root impact term. We compute participation rate per bar as a first-class column and reject strategies whose median entry exceeds a few percent of bar notional, because everything downstream of that is fiction.
Trade count also flags the weird minutes cheaply. Volume normal, trade count collapsed to 11? Someone did a block. Volume normal, trade count at 9,000? That's a liquidation cascade being chewed through in tiny pieces.
[9] and [10]: "21.883", the field everybody throws away
Taker buy base volume. 21.883 of 38.417 BTC in this bar was buyer-initiated, so signed volume delta is +5.349 BTC and the aggressor split is 57/43 toward buyers. The exchange is handing you order flow imbalance, for free, in a field most people never read because pandas didn't name the column for them.
I'm not claiming it predicts returns on its own; naive delta strategies are among the more reliable ways to donate to the fee ledger. But it's a genuinely different measurement from price, it's available in the same request you were already making, and it lets you distinguish a rally that was bought from a rally that happened because sellers stepped away. Those two look identical in OHLC and behave differently ten minutes later. Our research agent treats a hypothesis that ignores the taker split on a venue that publishes it as leaving evidence on the table.
[11] "0": ignore — and everything else that isn't here
Index 11 is a deprecated field, permanently zero. More interesting is the list of things this bar does not contain: no bid, no ask, no spread, no book depth, no funding rate, no open interest, no liquidations, no mark price, no index price. And crucially, no way to know whether your order would have been maker or taker, which is the difference between paying 0.045% and earning 0.01% on this venue.
So any fee model built on klines alone is an assumption wearing a number's clothes. We resolve it by forcing every strategy to declare its execution style up front, and then charging taker on anything that can't prove otherwise.
The bar that never showed up
Last piece, and the one that bites hardest outside majors. A minute with zero trades produces no kline at all. Vendors and libraries commonly forward-fill it: open = high = low = close = previous close, volume 0. Your indicator computes happily. Your strategy sees a valid row and can generate a signal on a minute in which nobody in the world traded that instrument.
On one mid-cap perp we ingested, 4.1% of 1-minute bars in a twelve-month window had zero trades. A mean-reversion candidate on that symbol was placing 38% of its entries on synthetic bars, because flat synthetic prices are catnip to anything measuring deviation from a moving average. It backtested beautifully. It was trading the gaps in the data.
Which is why the ingest layer now carries a synthetic boolean per bar, propagated through every resample, and the verification gauntlet fails any strategy whose trades cluster on it. Cheap column. It has killed more candidates than any indicator we've ever written.
Twelve values. Four of them routinely misread, two of them routinely discarded, and an entire category of them absent from the row and imagined by the engine. Before your next backtest, go pull one raw bar from your own store and read every field out loud against what your fill logic assumes about it. It's a twenty-minute exercise and I've never seen anyone do it and find nothing.
← All posts