Simulate the next chapter
Paper trading uses a separate run on incoming market data. Orders and fills are simulated; they are not evidence of identical live execution.
Paper trading
Monitor strategies built by the AI factory after they pass admission checks. The paper engine runs them on incoming market data with simulated orders, positions and performance records.
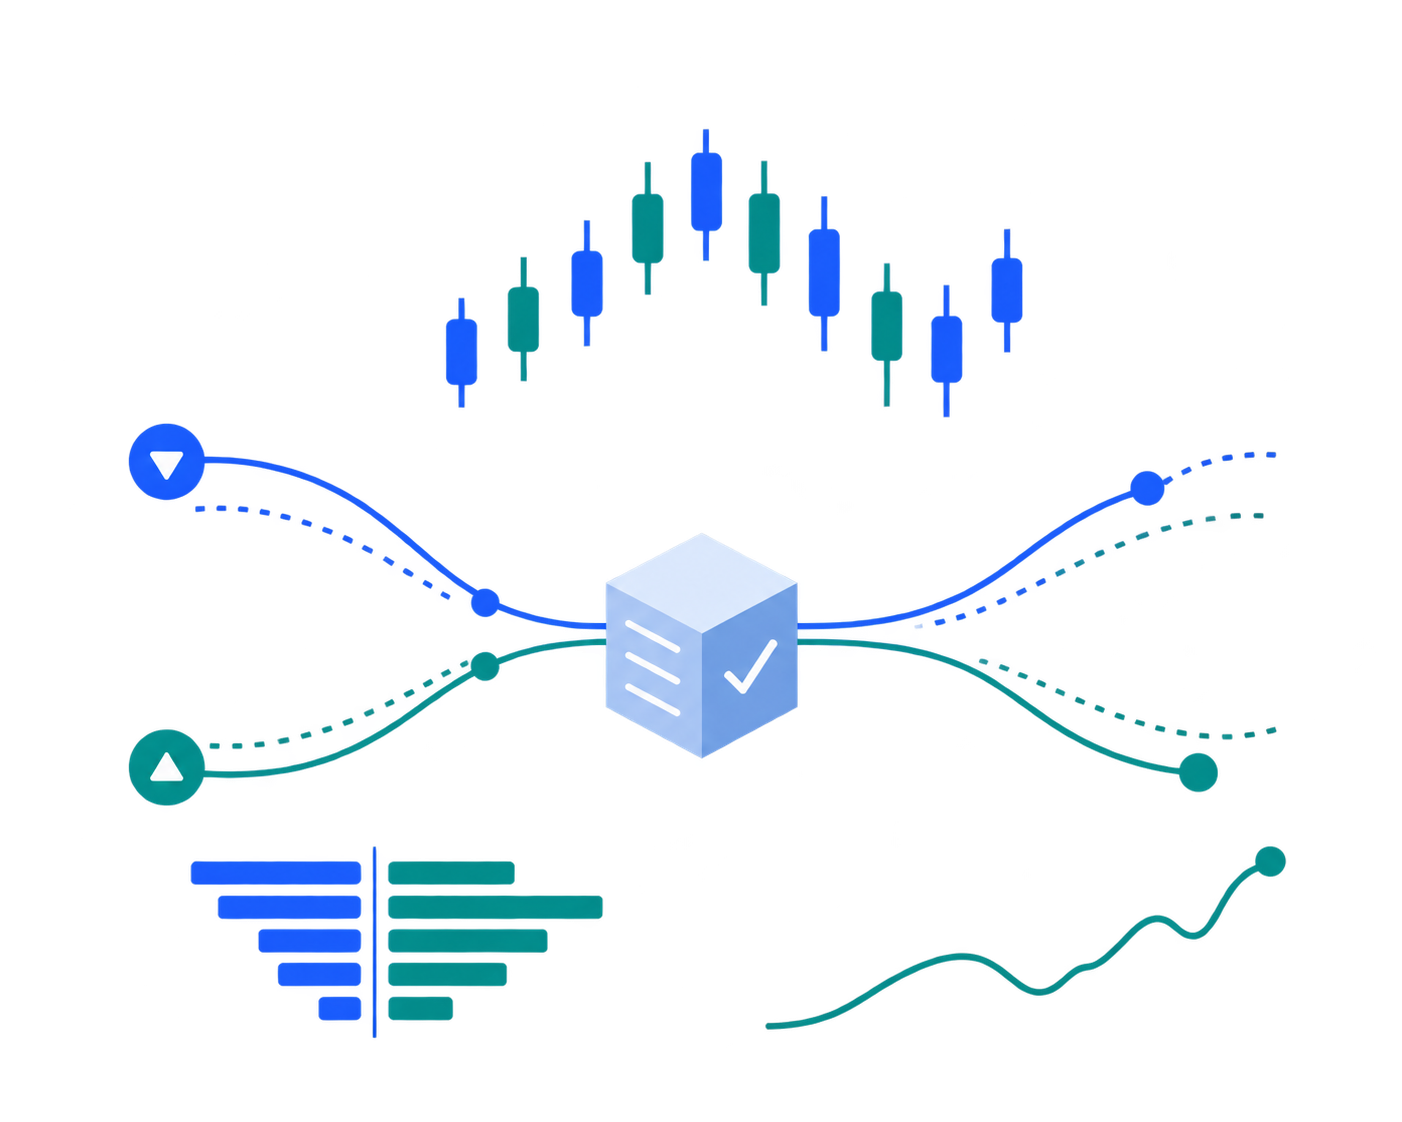
Illustrative example · not a live result
AI agents develop the idea, write code and assess the test results. Review findings can send the strategy back for another iteration.
An illustrative equity curve reveals setbacks along the way. Inspect drawdown and trading costs before interpreting a result.
Compare account equity with closed-trade balance. An open position can change equity before a trade closes.
Paper trading uses a separate run on incoming market data. Orders and fills are simulated; they are not evidence of identical live execution.
Review paper positions, trades and equity over time. Compare behavior with the research assumptions rather than judging a strategy from one short window.
Starting research or buying a plan does not enable real-money trading. Live execution is a separate restricted path requiring explicit authorization and additional controls.
Live market conditions can expose behavior that historical tests miss. Paper records help you review that behavior while keeping simulated execution clearly separate from real capital.
Approved strategy and paper slot
Positions, trades, equity
Review, continue or retire
Paper trading combines incoming market data with simulated execution. The resulting record lets you compare actual strategy behavior with the research assumptions.
New prices reach the strategy.
The implemented rules decide whether to act.
The paper engine models orders and fills.
Positions, trades and equity support review.
The diagram describes the paper path. Available feeds and execution models vary by venue; simulated fills are not exchange confirmations.
Use the paper record to investigate whether the strategy is acting as designed. A quiet period can be informative when the entry conditions have not occurred.
Scroll horizontally to see all columns.
| Review | Compare with the research | Investigate |
|---|---|---|
| Positions | Direction, size and intended holding period. | Unexpected exposure or positions held beyond the intended exit. |
| Trades & fees | Expected activity and modeled trading costs. | Overtrading, missing expected trades or cost-sensitive results. |
| Equity & drawdown | The historical range of losses and recovery periods. | A change in loss pattern or prolonged deterioration. |
| Observation window | The number of trades and market conditions seen. | Conclusions based on a few trades or only one market regime. |
Pause or stop paper work when you need to investigate. A pause is a control on the run, not proof that existing simulated positions were closed; inspect the position record.
Interactive illustration
Open positions can change equity before a trade closes. Inspect the same checkpoint across equity and drawdown to see the path behind the final result.
A rising closed-trade balance can still coincide with falling equity. Review open exposure and drawdown alongside completed trades; a short paper record cannot establish future performance.
Account value index · starts at 100
Drawdown from running peak
The Paper Trading workspace shows available decision-parity measurements: matched decisions, quantity differences, entry and exit timing, and trades seen only in paper or replay. A comparison helps identify implementation differences; a match does not establish profitability or guarantee live fills.
No. Research coverage, live data browsing and paper execution are different capabilities. Availability depends on the venue and enabled execution path.
No. Real orders can face different liquidity, latency, fills and operational constraints. Paper performance is hypothetical.
The run must pass the applicable reviews and admission checks, have a matching release record and fit within the available paper capacity. The venue and execution path must also be supported. A research result or a purchased plan alone does not admit a strategy.
Its entry conditions may not have occurred, it may still need enough incoming data, or it may be paused or waiting on an operational condition. Check the run status, data availability and expected trading frequency before assuming that no trades means the strategy is broken.
Review positions, trade frequency, fees, equity and drawdowns against the research assumptions. Check whether positions exit as intended and whether enough trades and market conditions have been observed. One short profitable window is not sufficient evidence of consistent behavior.
Do not assume so. Pause and stop controls change whether the run is eligible to continue executing; they are not a promise that every existing simulated position has been closed. Inspect the position and trade records when reviewing the outcome.
Explore published strategies, or open a workspace to build, test and monitor your own with AI agents.
Stratmill is an AI trading strategy platform, not financial advice or a broker. Backtest and paper results are hypothetical. Trading involves risk of loss.